Square wheels
Posted by David Zaslavsky on — CommentsIt hasn’t escaped my notice that Mythbusters is back with a new season! Actually, it’s not really that new, since we’re now three (well, now four) weeks in, but I missed the first two episodes since I was out of the country. But it works out because this (actually last) week’s myth is full of interesting physics to analyze!
This past Sunday, Adam and Jamie tested the myth that if you’re driving fast enough, square wheels can actually provide a surprisingly smooth ride. At first, the idea of square wheels working at all, much less actually being smooth, can seem a little wacky, but with a bit of physical intuition, it’s not hard to convince yourself that it’s actually pretty plausible. As they explained in the show, the reason a square wheel is expected to bounce you up and down is that the distance from the axle to the bottom of the wheel changes as it turns. If you’re going slowly, every time the wheel tips over another corner, it’s going to fall down until its side is resting against the ground, taking you with it. But if you speed up enough, the wheel won’t have time to fall very far before it rotates through a quarter turn, and the next corner gets under it to hold it up.
Simple model: a slowly turning wheel
You can actually calculate about how fast you would need to go to do this. Let’s consider just a single square wheel, and at first, suppose it’s going really slowly. That way, the wheel is going to constantly stay in contact with the ground. There are basically two “phases” in the cycle of a slowly turning square wheel:
- Starting from a position where the wheel is “perched” on its corner with the corner pointing down, it’s going to first just pivot forward around that corner, and fall down on its side.
- After that, it’ll pivot up around the next corner, until that next corner is now pointing down.

Suppose the wheel has a side length of \(2r\) and is rotating at angular speed \(\omega\), which I’m going to assume is constant for simplicity. Based on geometry, the height of the first corner relative to the wheel’s center is
and since the second corner trails by an angle of \(\frac{pi}{2}\) (a quarter circle), its height relative to the center is going to be
At any given time, the height of the lowest point on the wheel relative to its center will be the lesser of these two expressions: \(y_1\) for the first eighth turn, and \(y_2\) for the next eighth. But what we really want is the height of the center of the wheel above the ground, which will be the negative of that minimum:
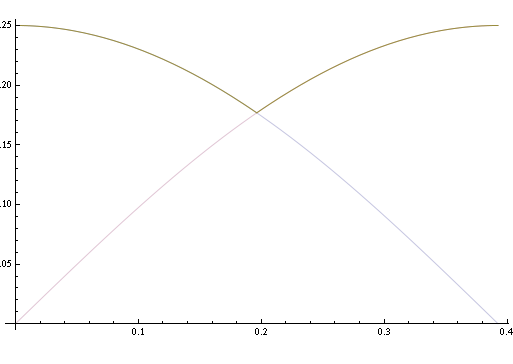
This function tells us the height of the truck as a function of time as one quarter turn of the wheel elapses. It looks like this:

From this, we should be able to figure out how bumpy the ride on this slowly turning wheel would be. But that brings up another question: how exactly do you measure bumpiness?
Think back to the last time you were on a car driving on a road with a lot of potholes, or any other rough surface. What makes it unpleasant is that you get shaken up and down a lot. The larger the vibrations, the rougher the ride. So it makes sense to say that our measure of bumpiness should be related to the distance by which the car bounces up and down in a cycle — in other words, the maximum height minus the minimum height, which is often called peak-to-peak amplitude.
But if you think about it, the time scale over which these oscillations occur is also important. When you drive up and down a mountain, that’s a huge bounce, but it doesn’t feel like it because it’s so slow. So the “bumpiness metric” should also be anti-correlated to the cycle time: quicker bumps at the same amplitude have more of an effect. Accordingly, I’m going to define a simple measure of bumpiness as the ratio of the peak-to-peak amplitude to the period for one up-and-down cycle of oscillation (which is actually a quarter cycle of the wheel). I’m sure there are more complicated (and more realistic) ways to define bumpiness, but this one should be good enough to make my point here.
For the model of a slowly rotating square wheel, we can find the peak-to-peak amplitude using the maximum value of \(y(t)\), which occurs at \(t = 0\) (and again at \(t = \pi/2\omega\)), and the minimum value, which occurs at \(t = \pi/4\omega\).
Speeding it up
With the simple slow wheel model out of the way, let’s see what happens when you speed the wheel’s rotation up. The most important change comes from the fact that there is nothing actually holding the wheel’s surface to the ground. In the first part of the cycle, the only thing pulling the wheel down is gravity, and gravity can’t accelerate it any faster than \(\SI{9.8}{m/s^2}\). So if our slow-wheel model says that the wheel should be moving downward at faster than \(g = \SI{9.8}{m/s^2}\), that is if \(y''(t) < -g\), then we’ve got a problem.
Of course, it’s not hard to figure out when this actually does happen, using basic Newtonian mechanics. There are two relevant forces acting on the wheel, gravity and the normal force from the ground. Their relationship is given by Newton’s second law, \(\sum F = ma\), or in this case:
For a slowly rotating wheel, \(\omega\) is small, and thus \(F_N\) will need to be positive to make this equation true. Once \(\omega\) gets large enough that \(-mg > -\sqrt{2}mr\omega^2\cos(\omega t)\), though, there will be no zero or positive value of \(F_N\) that can make the equation true. That’s when the wheel is going to leave the ground. This will happen at \(t = 0\) as long as
If the normal force is going to be zero, the wheel won’t be touching the ground as it rotates. Instead, it’s going to be in free fall for some amount of time. That’s an easy situation to analyze; the height of an object in free fall is just \(y = y_0 + v_0 (t - t_0) - g(t - t_0)^2/2\), and since in this case the free-fall phase starts at time 0 with zero vertical velocity, that just reduces to
The wheel will remain in free fall as long as this height \(y_\text{free}\) is greater than the height difference between the center of the wheel and its lowest point. The latter quantity is something we’ve already calculated: it’s \(y_\text{slow}\). So we need to identify the first nonzero time at which \(y_\text{free}(t) = y_\text{slow}(t)\), the solution to
This is a little tricky for a couple of reasons: first, it’s a transcendental equation, because it involves both a polynomial in \(t\) and a trigonometric function of \(t\). That means you can’t write the solution as a symbolic function. You can still solve it numerically, though, and that’s what I’m going to do shortly. The other issue is that it has a piecewise function on the right. That’s not that hard to deal with, at least not if you have numbers for everything; you can just solve the first case, and see if the solution you get satisfies the condition for that case (\(0 \le t < \frac{\pi}{4\omega}\)); if not, then the solution comes from the second piece. It turns out that in our situation, because of the requirement \(\omega^2 > g/\sqrt{2}r\), the solution is almost always going to come from the second case; for most values of \(\omega\) the first corner of the wheel never touches the ground again after the very beginning of the cycle, and the small region of \(\omega\) where that’s not the case is basically negligible. (Plus it would take a whole other post to do that analysis properly) So we can reduce this last equation to
The solution to this tells us when the second corner of the wheel is going to hit the ground. Call that solution \(t_2\). Then the height as a function of time for a square wheel which does not have to be moving slowly is
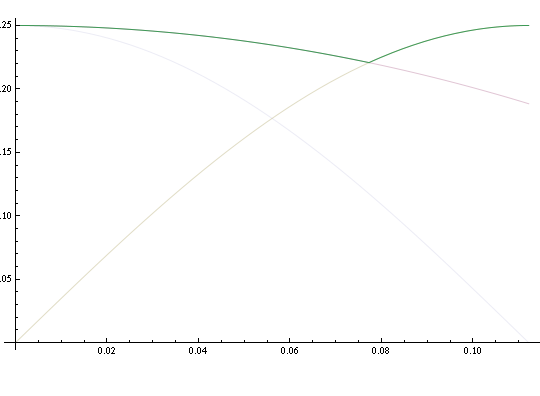
This function looks like this:

Notice the difference between this and the equivalent graph for a slow wheel (which is included in the background, for comparison). The peak-to-peak amplitude of this motion is considerably less. This will also be reflected in the formula for the bumpiness, which is
Putting it all together
To recap, our measure of bumpiness over all possible rotational frequencies is given by the following piecewise function:
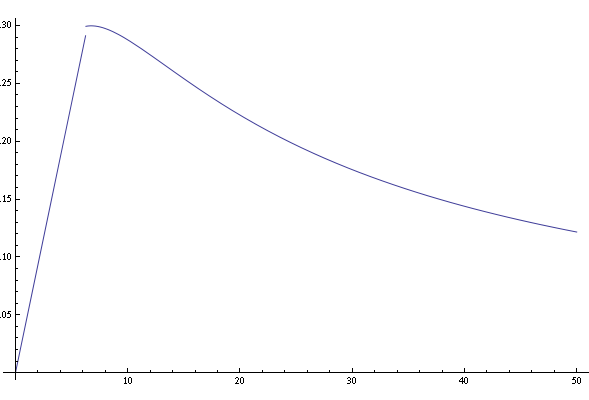
For a square wheel with a \(\SI{50}{cm}\) side length, a plot of this function looks like this:

The horizontal axis shows speed in meters per second. There’s a peak in the graph around \(\SI{6.2}{m/s}\), or \(\SI{14}{mph}\), and after that it starts going down — which means that for this size of wheel, once you pass 14 miles per hour, the ride actually should start getting smoother! And that’s pretty close to what Jamie and Adam actually observed in the show.