Two complex color functions
Posted by David Zaslavsky on — Edited — CommentsIn the process of graphing some complex valued functions, I figured out a couple of neat coloring schemes that I thought might be worth sharing. Both schemes share the same hue and saturation functions:
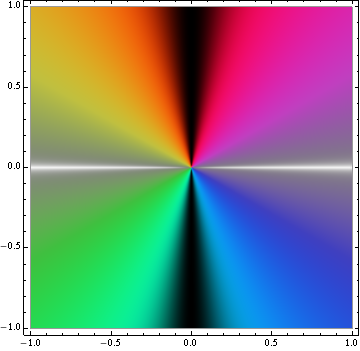
They differ in the third component, though. The one which I will arbitrarily designate “color scheme 1” (because I like it better) is defined in HSL color space, and has a luminosity function of
where \(S\) is the saturation value. This maps all real or nearly real numbers to white, all imaginary or nearly imaginary numbers to black, and other complex numbers to varying hues depending on their phase.

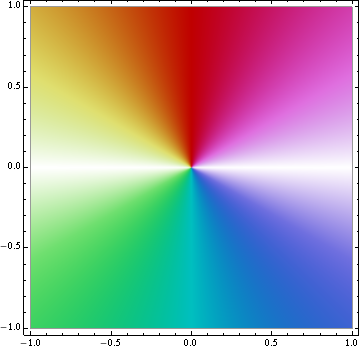
The other one, “color scheme 2,” has a value (brightness) function of
This maps all real or nearly real numbers to white, and all other numbers to varying hues, again depending on their phase. Positive imaginary numbers are red, negative imaginary numbers are cyan.

Note that both functions are undefined at \(z = 0\). If you implement these you’ll have to manually set that point to whatever color you want.
Complex-valued functions are pretty common in modern math and physics, but they’re hard to visualize: since both the input and output of the function are complex numbers, which have two independent components, you would need to make a four-dimensional graph to show the function properly. We typically get around this by plotting the absolute value of the complex function, and using color schemes like these to indicate the phase, when it’s important. The usefulness of these two is that they highlight the regions where the function being plotted is purely real, which is typically an interesting region to focus on.
Since I developed these in Mathematica, I’m attaching a Mathematica notebook containing a reference implementation.